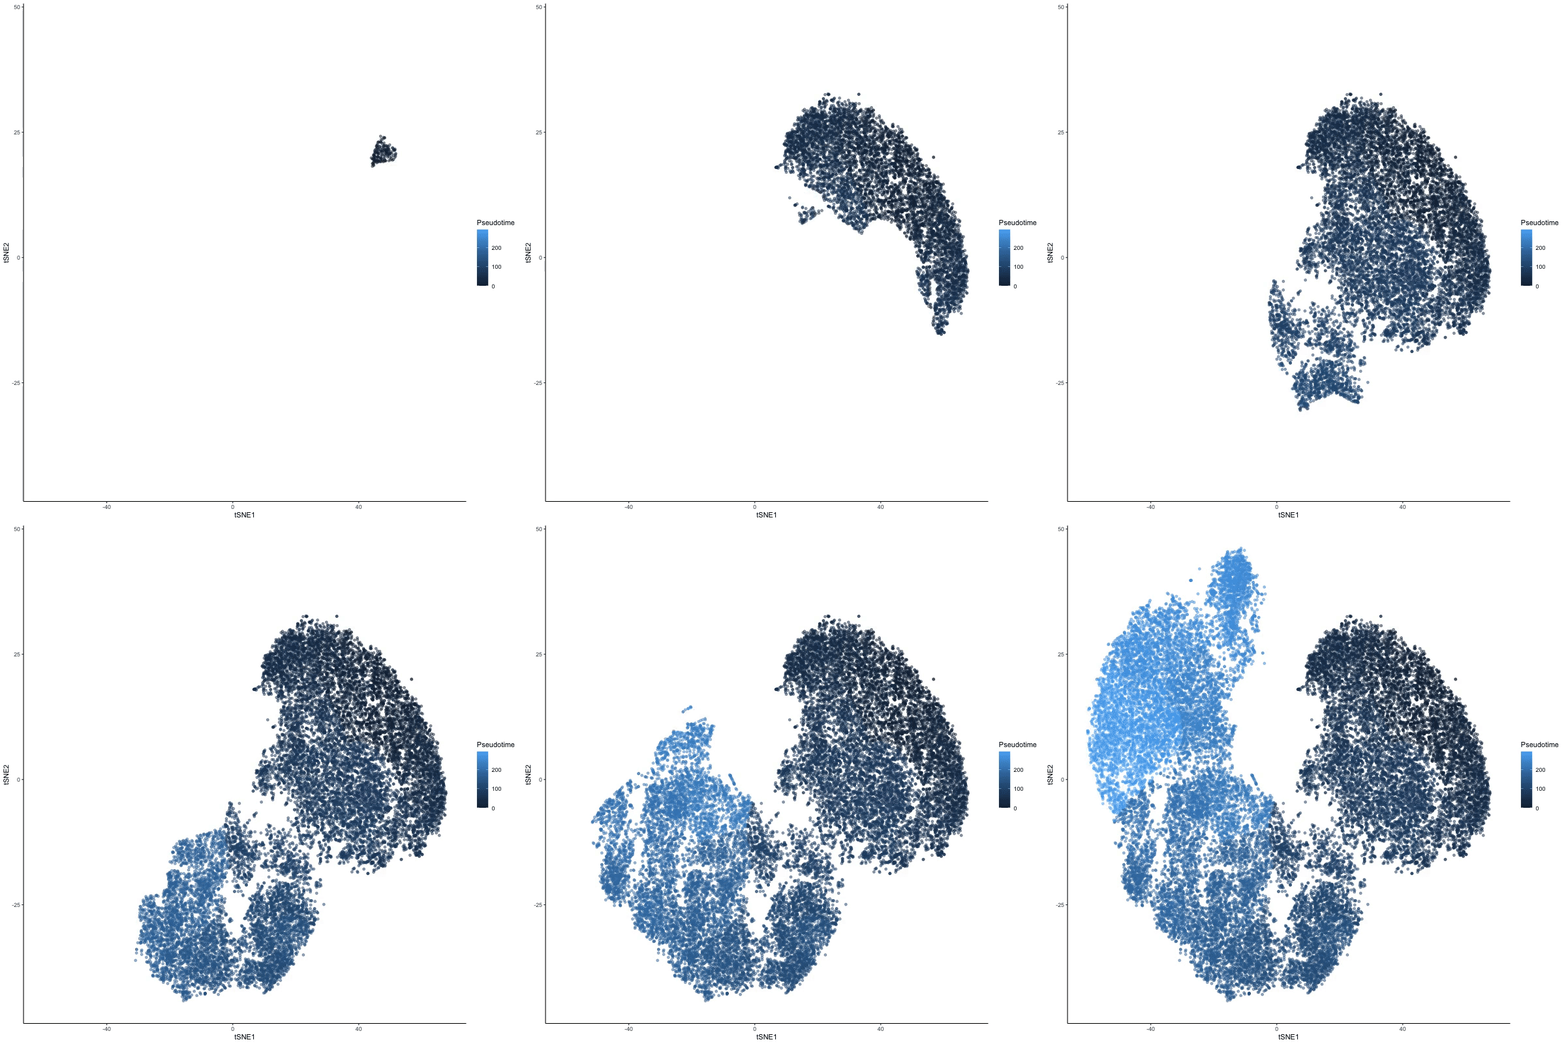
Flow cytometry data is multi-dimensional. Each cell is analysed for its expression pattern of various proteins. Thereby, the data is inherently complex and difficult to clearly understand. Over the past few years dimensionality algorithms have been developed and have gained popularity in the analysis of biological data. This shiny app aids the analysis of flow cytometry files, including dimensionality algorithms (tSNE and UMAP), clustering methods (Phenograph, ClusterX and DensVM), as well as trajectory inference methods (slingshot).
